Pointing at circles
September 2022
I recently had a need to draw a series of circles connected with directional arrows. The circles could be anywhere in a given cartesian space and could have an arbitrary radius. I needed the arrows to point from one circle to the other and for the arrow head to just touch the edge of the second circle.
The circles would be drawn dynamically using SVG inside a web page.
I’m writing this article to record my solution for my future self to reference, and in the hope that someone else might find it useful in the future
Setup
I made a plain HTML file with an SVG placeholder, added a simple CSS and empty javascript file. Furthermore, I imported the d3 library (from a CDN) because it makes code for adding SVG elements to the DOM a bit simpler.
index.html
<!DOCTYPE html>
<html>
<head>
    <title>Pointing at circles</title>
    <link rel="stylesheet" type="text/css" href="app.css">
</head>
<body>
    <p>Pointing at circles</p>
    <svg id="trigTest"></svg>
</body>

<script src="https://d3js.org/d3.v5.min.js"></script>
<script type="text/javascript" src="app.js"></script>
</html>
app.css
html {
    font-family: sans-serif;
}

svg {
    width:  300px;
    height:  300px;
    border:  1px solid red;
}
I served the page on my local machine using a quick python web server python -m http.server and opened a browser at http://localhost:8000 to be greeted with a blank page apart from a red-outlined box showing the SVG element.
Experiment 1
I find it useful to break a challenge like this down into component experiments. The first step was to draw some circles and lines. I knew that this task would involve drawing circles at different angular positions to each other, so I began by making a single “central” circle and surrounding it with a ring of “outer” circles.
The central circle is drawn by placing it at the centre of the SVG element (svgWidth / 2 or 150 pixels in either dimension).
app.js
// Define the size of the area we are working with and a centre point
var svgWidth = 300;
var svgCentre = svgWidth / 2;

// Size of the central circle
var centreRadius = 10;

// Get a reference to the SVG element with d3
var svg  = d3.select("svg#circleTest");

// Add a single, central circle
var centre = svg.selectAll("circle#centrePoint")
  .data([0]);

centre.enter().append("circle")
  .attr("id", "centrePoint")
  .attr("cx", svgCentre)
  .attr("cy", svgCentre)
  .attr("fill", "red")
  .attr("r", centreRadius);
Next, we need to define the points where the outer circles will sit. This is just an array of angles. Note, we are using radians, as this is what the JavaScript trigonometric functions expect as parameters.
// Controls the number of circles
var n = 12;

// The angular spacing between n points on a full circle (2*π radians)
var ang = 2 * Math.PI / n;

// Make an array of n angular spacings
var points = [];
for(var i=0; i<n; i++){
  points.push(i*ang);
}
Now we can add the points to the SVG as smaller circles. They will be positioned on a ring that is centred on the centre circle (also the centre of the SVG element, as described above). The ring will have a radius of 70px.
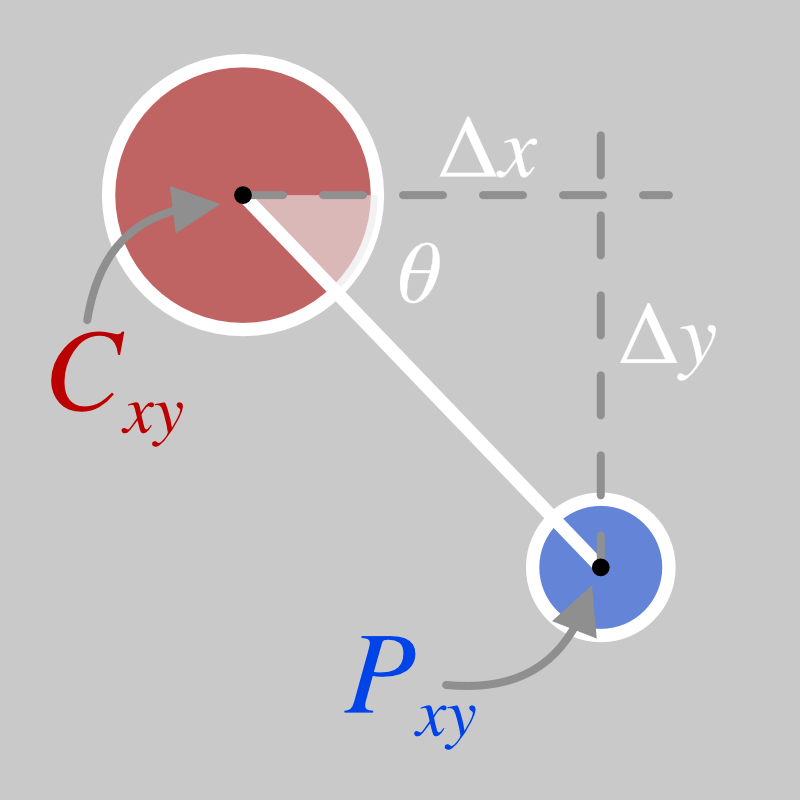
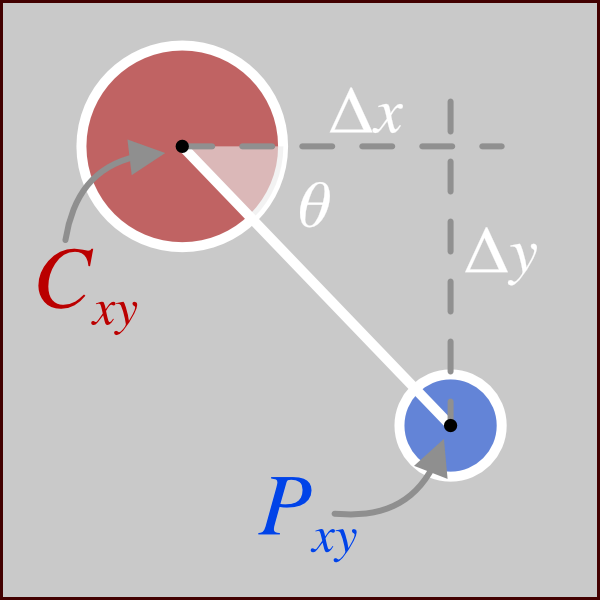
The x- and y- coordinates of a given point \(P_xy\) can be calculated from the angle between the point and the centre \(\theta\), the coordinates of the centre circle \(C_xy\) and the distance to the outer ring \(d\), as shown in the diagram below:
Note: in the SVG coordinate system, the x-axis increases in value from left to right and the y-axis increases in value from top to bottom. Therefore in the image above, \(P_x > C_x\) and \(P_y > C_y\).
The coordinates of each point are therefore defined as:
$$
\begin{align}
P_x &= C_x + d \cdot \sin(\theta) \\
P_y &= C_y + d \cdot \cos(\theta)
\end{align}
$$
In the JavaScript, we use:
// Define the radius of the circle that the outer points sit on
var outerDistance = 70;

// and the size of the outer points
var outerRadius = 5;

// Draw the outer points
var outer = svg.selectAll("circle.outerPoint")
  .data(points);

outer.enter().append("circle")
  .attr("class", "outerPoint")
  .attr("cx", d => (svgCentre) + (outerDistance * Math.sin(d)))
  .attr("cy", d => (svgCentre) + (outerDistance * Math.cos(d)))
  .attr("fill", "blue")
  .attr("r", outerRadius);
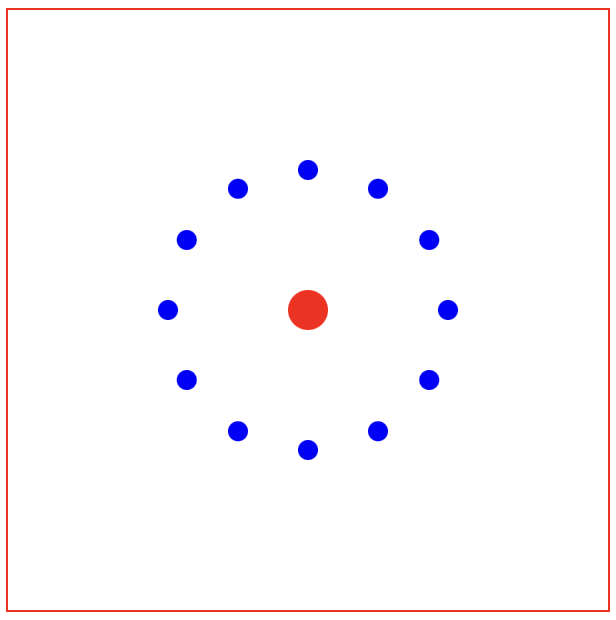
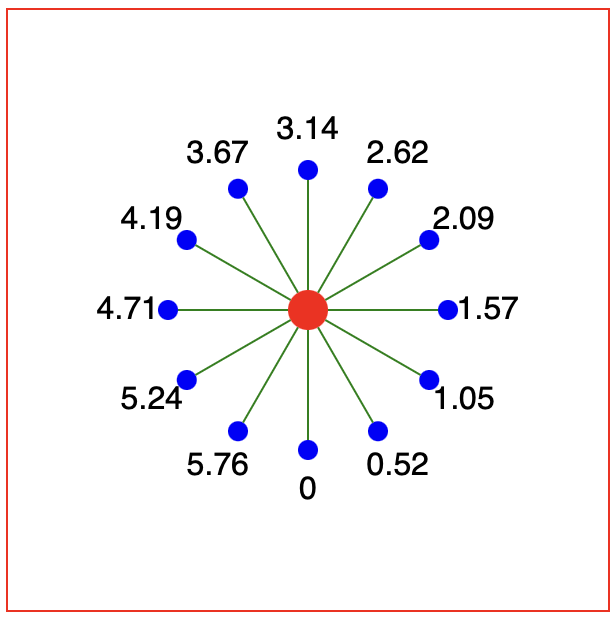
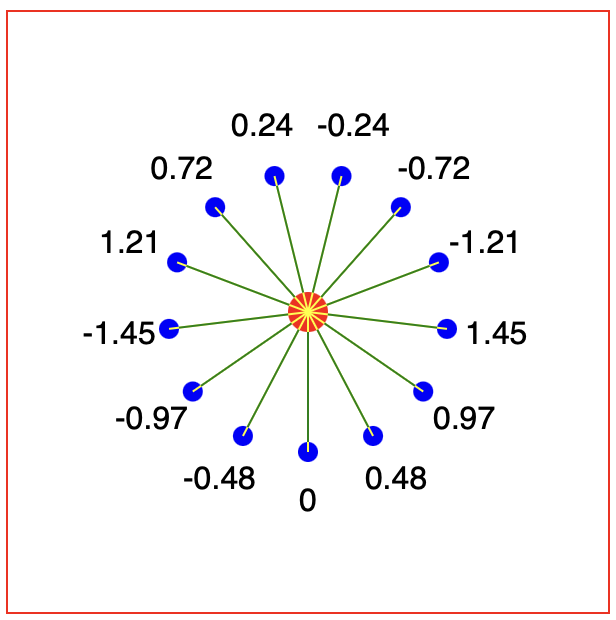
When we refresh the browser window, we get a red central circle surrounded by a ring of twelve blue outer circles.
Labelling
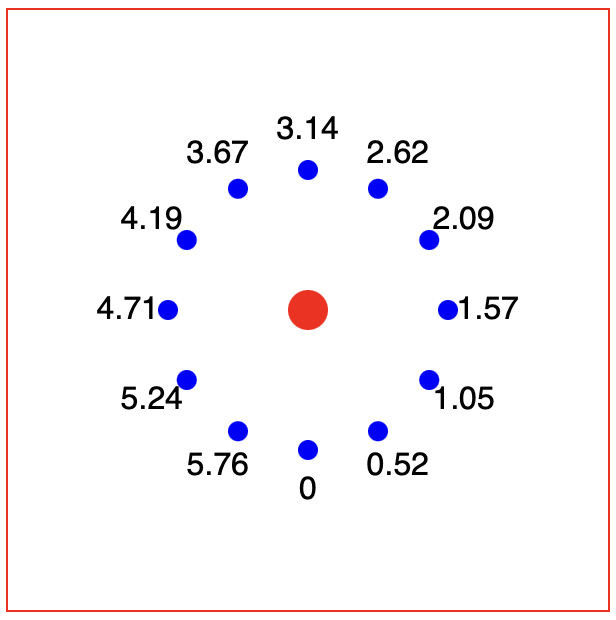
As this is set up, the outer circle directly below the centre circle is the first one to be drawn, at 0 radians. The circles then continue anti-clockwise around the outer ring (i.e. the circle at the furthest right is at π/2 radians and the circle at the top is at π radians etc.)
I always struggle to work out where the angular origin is, so I add labels to each of the circles with their angle (rounded to 2 decimal places):
var labelDistance = outerDistance + 20;
var outerLabel = svg.selectAll("text.outerLabel")
  .data(points);

outerLabel.enter().append("text")
  .attr("class", "outerLabel")
  .attr("x", d => (svgCentre) + (labelDistance * Math.sin(d)))
  .attr("y", d => (svgCentre) + (labelDistance * Math.cos(d)))
  .attr("dominant-baseline", "middle")
  .attr("text-anchor", "middle")
  .text(d => Math.round(d*100)/100);
Note that the positioning of the labels is the same as the outer circles, but with a slightly increased (+20 pixel) radius, so they can be read. We also set the dominant-baseline (vertical alignment) and text-anchor (horizontal alignment) so the labels are centrally aligned.
Basic lines
We could now add lines going from the centre of one circle to the other:
var lines = svg.selectAll("line")
  .data(points);

lines.enter().append("line")
  .attr("x1", svgCentre)
  .attr("y1", svgCentre)
  .attr("x2", d => svgCentre + ((outerDistance) * Math.sin(d)))
  .attr("y2", d => svgCentre + ((outerDistance) * Math.cos(d)))
  .attr("stroke", "green");

But these lines will end up overlapping the circles. We could arrange the SVG elements so that the lines go underneath the circles (SVG elements are “painted” in order, so adding the lines first would put them “underneath” the circle). However, this would mean:
- We couldn’t use circles with transparent or no colour fills, as then you would see the lines underneath
- When we were to add arrow markers (see below), then the arrows would be underneath the circle (or not at the right point on the line if the radius of the second circle was changed).
Instead, we need to offset the start and end points of the lines using the radii of the central and outer circles:
var endRadius = outerDistance - outerRadius;
var lines = svg.selectAll("line")
  .data(points);

lines.enter().append("line")
  .attr("x1", d => svgCentre + (centreRadius * Math.sin(d)))
  .attr("y1", d => svgCentre + (centreRadius * Math.cos(d)))
  .attr("x2", d => svgCentre + (endRadius * Math.sin(d)))
  .attr("y2", d => svgCentre + (endRadius * Math.cos(d)))
  .attr("stroke", "green");
Experiment 2
Now we need a way of drawing the lines when the points are defined not by an angle, but by a pair of cartesian x/y coordinates.
First, let's simulate some test data by changing the point generation loop above to give x- and y- coordinates. This will give us 13 in a complete circle, so we can check our drawing code works for different angular positions. We use 13 now rather than 12 to break the symmetry to make debugging easier (see below).
var n = 13;
var ang = 2 * Math.PI / n;

var points = [];
for(var i=0; i<n; i++){
  points.push({
    x: svgCentre + (outerDistance * Math.sin(i*ang)),
    y: svgCentre + (outerDistance * Math.cos(i*ang)),
  });
}
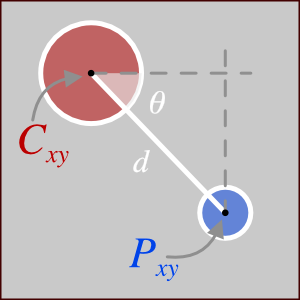
Now we can use our test data and compute (back) the angle value, as shown in the diagram below:
By taking the x and y distances between each point and the centre point and using the arctan trigonometric function, we can get the angle:
$$\theta = \tan^{-1} \left(\frac{\Delta x}{\Delta y}\right) = \tan^{-1} \left(\frac{C_x - P_x}{C_y - P_y}\right)$$
for(var point of points){
  point.dx = svgCentre - point.x;
  point.dy = svgCentre - point.y;
  point.theta = Math.atan((svgCentre - point.x)/(svgCentre - point.y));
}
This simplifies the code for positioning the outer circles to (other lines omitted for brevity):
outer
    .attr("cx", d => d.x)
    .attr("cy", d => d.y)
For visual reference, we can also easily add lines going from/to the centres of the circles easily:
var lines = svg.selectAll("line.centralLine")
  .data(points);

lines.enter().append("line")
  .attr("class", "centralLine")
  .attr("x1", svgCentre)
  .attr("y1", svgCentre)
  .attr("x2", d => d.x)
  .attr("y2", d => d.y)
  .attr("stroke", "yellow");
Tangential issues
Now we can modify the code for drawing the lines from circle-edge to circle-edge:
var lines = svg.selectAll("line.edgeLine")
  .data(points);

lines.enter().append("line")
  .attr("class", "edgeLine")
  .attr("x1", d => svgCentre + (centreRadius * Math.sin(d.theta)))
  .attr("y1", d => svgCentre + (centreRadius * Math.cos(d.theta)))
  .attr("x2", d => d.x - (outerRadius * Math.sin(d.theta)))
  .attr("y2", d => d.y - (outerRadius * Math.cos(d.theta)))
  .attr("stroke", "green");
However, this doesn’t quite work:
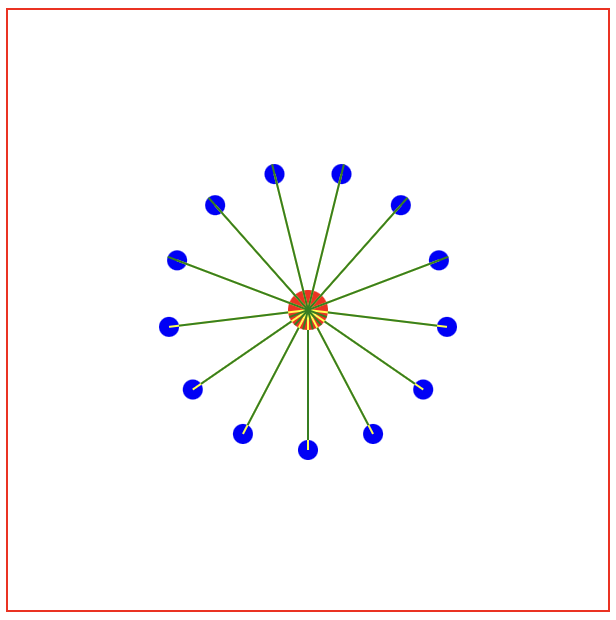
Some lines, specifically those in the top half of the circle, are going from the wrong side of the central circle to the wrong side of the outer circle. (Zoom in to see the overlap with the yellow lines).
So, what is going on here? Maybe adding back in the labels with the calculated angular position will help:
var labelDistance = outerRadius + 20;
var outerLabel = svg.selectAll("text.outerLabel")
  .data(points);

outerLabel.enter().append("text")
  .attr("class", "outerLabel")
  .attr("x", d => d.x + (labelDistance * Math.sin(d.theta)))
  .attr("y", d => d.y + (labelDistance * Math.cos(d.theta)))
  .attr("dominant-baseline", "middle")
  .attr("text-anchor", "middle")
  .text(d => Math.round(d.theta*100)/100);
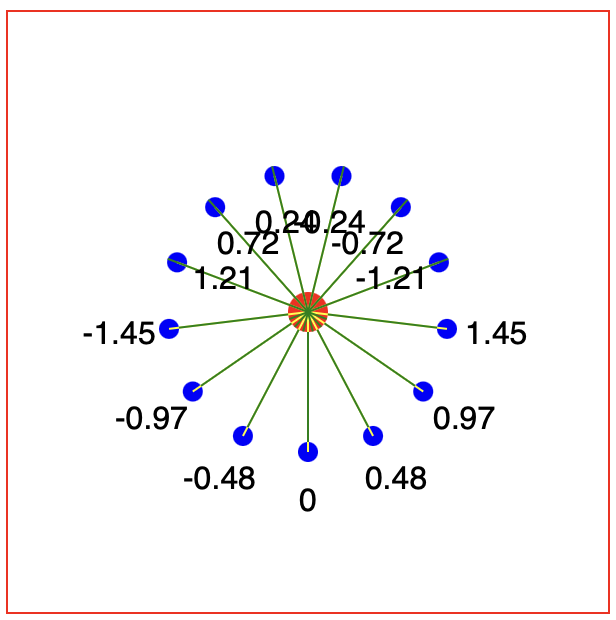
We now observe the same issue with the positioning of the labels as the lines, but more useful, we can see the angles are not the same values as seem in our first experiment. As before, the angular origin starts at zero with the bottom-most point. However, as it increases to \(\frac{\pi}{2}\) for the right most point, the sign of the angle flips to \(-\frac{\pi}{2}\). This angle value then increases through 0 at the top-post point, to \(+\frac{\pi}{2}\) at the left-most point, where the sign flips again to \(-\frac{\pi}{2}\).
This is a property of the tan function, where the domain maps from \(-\frac{\pi}{2}\) to \(+\frac{\pi}{2}\). A simple fix for this is to introduce a factor that can the sign of the addition / subtraction that is carried out when the line is drawn.
In the angle calculating routine, we introduce a factor (f) with value +1 or -1:
for(var point of points){
  point.dx = svgCentre - point.x;
  point.dy = svgCentre - point.y;
  point.theta = Math.atan((svgCentre - point.x)/(svgCentre - point.y));

  if(point.dy < 0){
    point.f = 1;
  } else {
    point.f = -1;
  }
}
We can then fix the lines and labels by introducing the factor:
var lines = svg.selectAll("line.edgeLine")
  .data(points);

lines.enter().append("line")
  .attr("class", "edgeLine")
  .attr("x1", d => svgCentre + (d.f * centreRadius * Math.sin(d.theta)))
  .attr("y1", d => svgCentre + (d.f * centreRadius * Math.cos(d.theta)))
  .attr("x2", d => d.x - (d.f * outerRadius * Math.sin(d.theta)))
  .attr("y2", d => d.y - (d.f * outerRadius * Math.cos(d.theta)))
  .attr("stroke", "green");
var labelDistance = outerRadius + 20;
var outerLabel = svg.selectAll("text.outerLabel")
  .data(points);

outerLabel.enter().append("text")
  .attr("class", "outerLabel")
  .attr("x", d => d.x + (d.f * labelDistance * Math.sin(d.theta)))
  .attr("y", d => d.y + (d.f * labelDistance * Math.cos(d.theta)))
  .attr("dominant-baseline", "middle")
  .attr("text-anchor", "middle")
  .text(d => Math.round(d.theta*100)/100);
Which gives us the correct line positioning.
Experiment 3
Now I want to be able to have any arbitrary position of the centre and outer circles, along with an arbitrary radius on the circles. Let’s update the point generating function to make random positions and radii, and also generate the central point as an origin point.
var point_origin = {
  x: Math.random()*svgWidth,
  y: Math.random()*svgWidth,
  r: centreRadius
};


var points = [];
var n = 10;
for(var i=0; i<n; i++){
  var point = {};

  point.x = Math.random()*svgWidth;
  point.y = Math.random()*svgWidth;
  point.r = Math.random()*outerRadius + 5;

  point.path = pathFinder(point_origin, point);

  points.push(point);

}
Now we can create a pathFinder() function that will calculate the path between the points, considering the two random positions and the factor to change the sign when one point is above the other.
function pathFinder(p1, p2){
  /* Path genrating function between the edges of two circles
        p1, p2 two points describing circles with attributes
            .x = x-centre of the circle
            .y = y-centre of the circle
            .r = circle radius
    */

  var dx = p1.x - p2.x;
  var dy = p1.y - p2.y;

  var theta = Math.atan(dx/dy);

  var factor;
  if(dy < 0){
    factor = 1;
  } else {
    factor = -1;
  }

  var line = {
    x1: p1.x + (factor * p1.r * Math.sin(theta)),
    y1: p1.y + (factor * p1.r * Math.cos(theta)),
    x2: p2.x - (factor * p2.r * Math.sin(theta)),
    y2: p2.y - (factor * p2.r * Math.cos(theta))
  };

  return line;
}
This simplifies the drawing of the lines:
var lines = svg.selectAll("line.edgeLine")
  .data(points);

lines.enter().append("line")
  .attr("class", "edgeLine")
  .attr("x1", d => d.path.x1)
  .attr("y1", d => d.path.y1)
  .attr("x2", d => d.path.x2)
  .attr("y2", d => d.path.y2)
  .attr("stroke", "green");
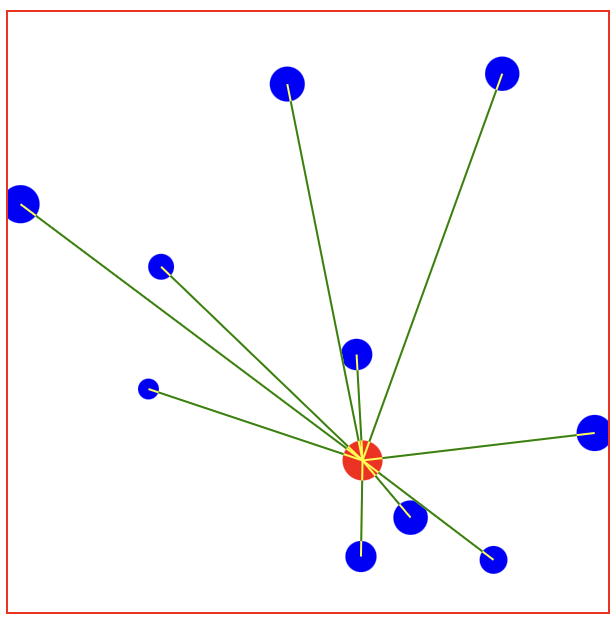
Now we can see a different random image every time the page is refreshed. This allows us to check the code can handle all range of positions.
Arrows
Finally, we can add arrows by defining a marker element in the defs
section of the SVG:
<svg id="circleTest">
    <defs>
        <marker id="arrow" markerWidth="10" markerHeight="10" refX="7" refY="3" orient="auto" markerUnits="strokeWidth">
            <path d="M0,0 L0,6 L9,3 z" fill="green" />
        </marker>
    </defs>
</svg>
Then in the code for drawing the lines, add a marker URL
lines.enter().append("line")
  // Other lines omitted for brevity
    .attr("marker-end", "url(#arrow)");
Which gives us our pointing arrows:
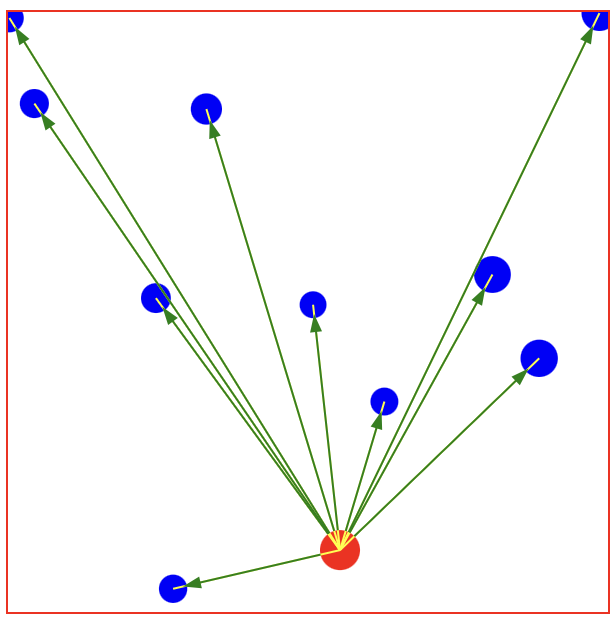
Example code
You can download the complete code from this github repository, it shows all three experiments on one page.